Week 2: The Truth About Drinking Water
Consultation has concluded
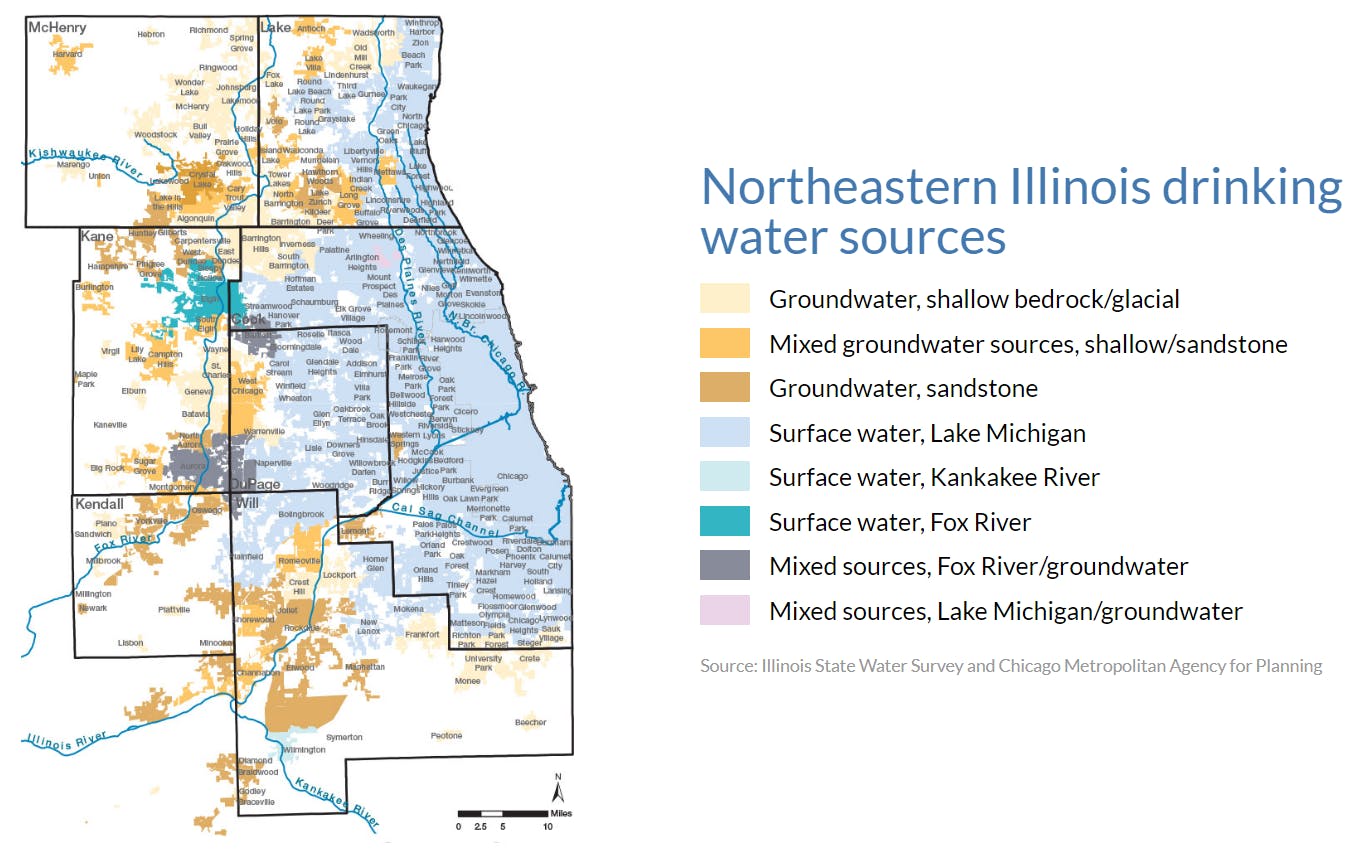
Water: A City's Basic Necessity

Do you know where we get our drinking water from? This foundational session will introduce you to the water systems in Northeastern Illinois, including sources of drinking water and the infrastructure that carries this water into our homes, schools, and businesses. Learn how local planning decisions influence water quantity, quality, and affordability, as well as how climate change impacts our region's future drinking water supply. Nora Beck, a senior planner at CMAP, will join this conversation in discussing CMAP's water planning initiatives. By the end of the session, you will have gained a deeper understanding of the current issues surrounding the region's drinking water.
About this Page
This is the landing page for our second week, which is on drinking water. Like last week, feel free to explore the tools below and to the right of this post to gain a better understanding of what you can look forward to in this session.
- Before Thursday's session, take a look through the Pre-session Content and Activity tabs below to familiarize yourself with relevant resources put together by the sessions leaders. These tools will help you form a foundation for the week's session.
- Let's Talk functions the same as the one found on the FLIP homepage and from urban street festivals last week. The only difference is that discussions are catered toward drinking water. Share your observations and knowledge on drinking water!
- Show off your water knowledge in Water Trivia. Answer correctly to get the chance to earn a gift card!
- Share your favorite picture of a beach, lake, pond, river - or any other body of water - in the Photo Board.
- Session documents can be found to the right. There, you will find relevant resources to help you start building a foundation of what you can expect for this week. Take a look through them before the session on Thursday.
- You can find out more about your session leaders under Meet the Team.
Click here to go back to the FLIP homepage.
Water affordability and Equity
Water affordability is a growing concern facing all municipalities in our region. To better understand and explore the extent to which communities are facing challenges to water affordability, Metropolitan Planning Council, Elevate Energy, and Illinois-Indiana Sea Grant developed a dashboard tool that breaks down water affordability statistics by municipalities in metropolitan Chicago. Explore the data on your own and join the live session to share your findings and discuss how to address water equity in a time of rising costs.
Select the community you live in or a community you are familiar with or are interested in knowing better, and post your responses to the following questions:
- What is the average water bill? How does it compare to other essential monthly expenses (i.e. housing and transportation costs)? Hover over the “Essential Monthly Costs” bar
- Has the average water bill increased or decreased since 2008? Why might the water bill have gone up or down?
- Has the water bill outpaced the growth in income? If so, by how much?
- How many hours does a low-income household need to work to pay their water bill?
Speaker Spotlight

Session Documents

Meet the Team
Videos
-
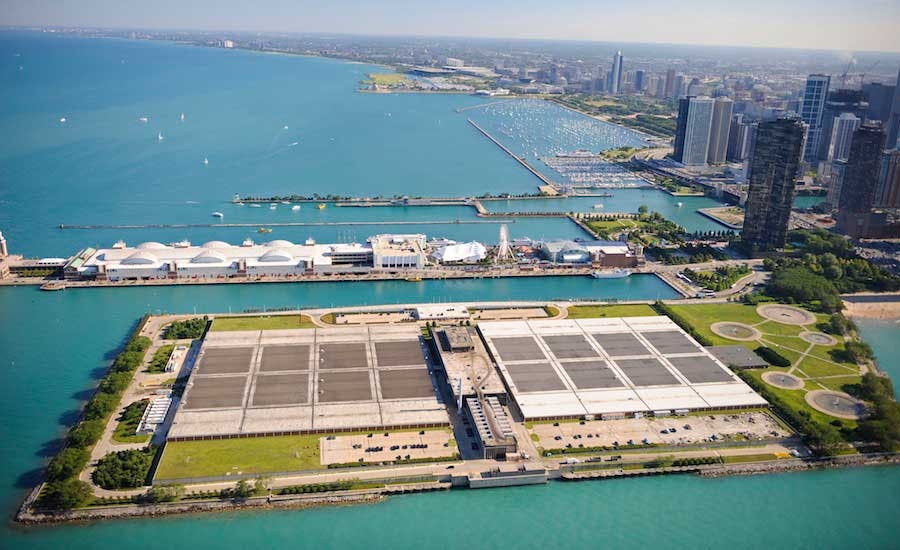
 The Terrence J. O’Brien Water Reclamation Plant (WRP) is one of seven wastewater treatment facilities owned and operated by the MWRD. The MWRD is the wastewater treatment and stormwater management agency for the City of Chicago and 125 Cook County communities. We work every day to mitigate flooding and convert wastewater into valuable resources like clean water, phosphorus, biosolids and natural gas.
If you live within our service area, the water that goes down your toilet, sinks and drains eventually comes to us to be cleaned. We treat wastewater from homes and businesses throughout our 883-square-mile service area in addition to stormwater from some communities. All of this wastewater and stormwater flows through local sewers into
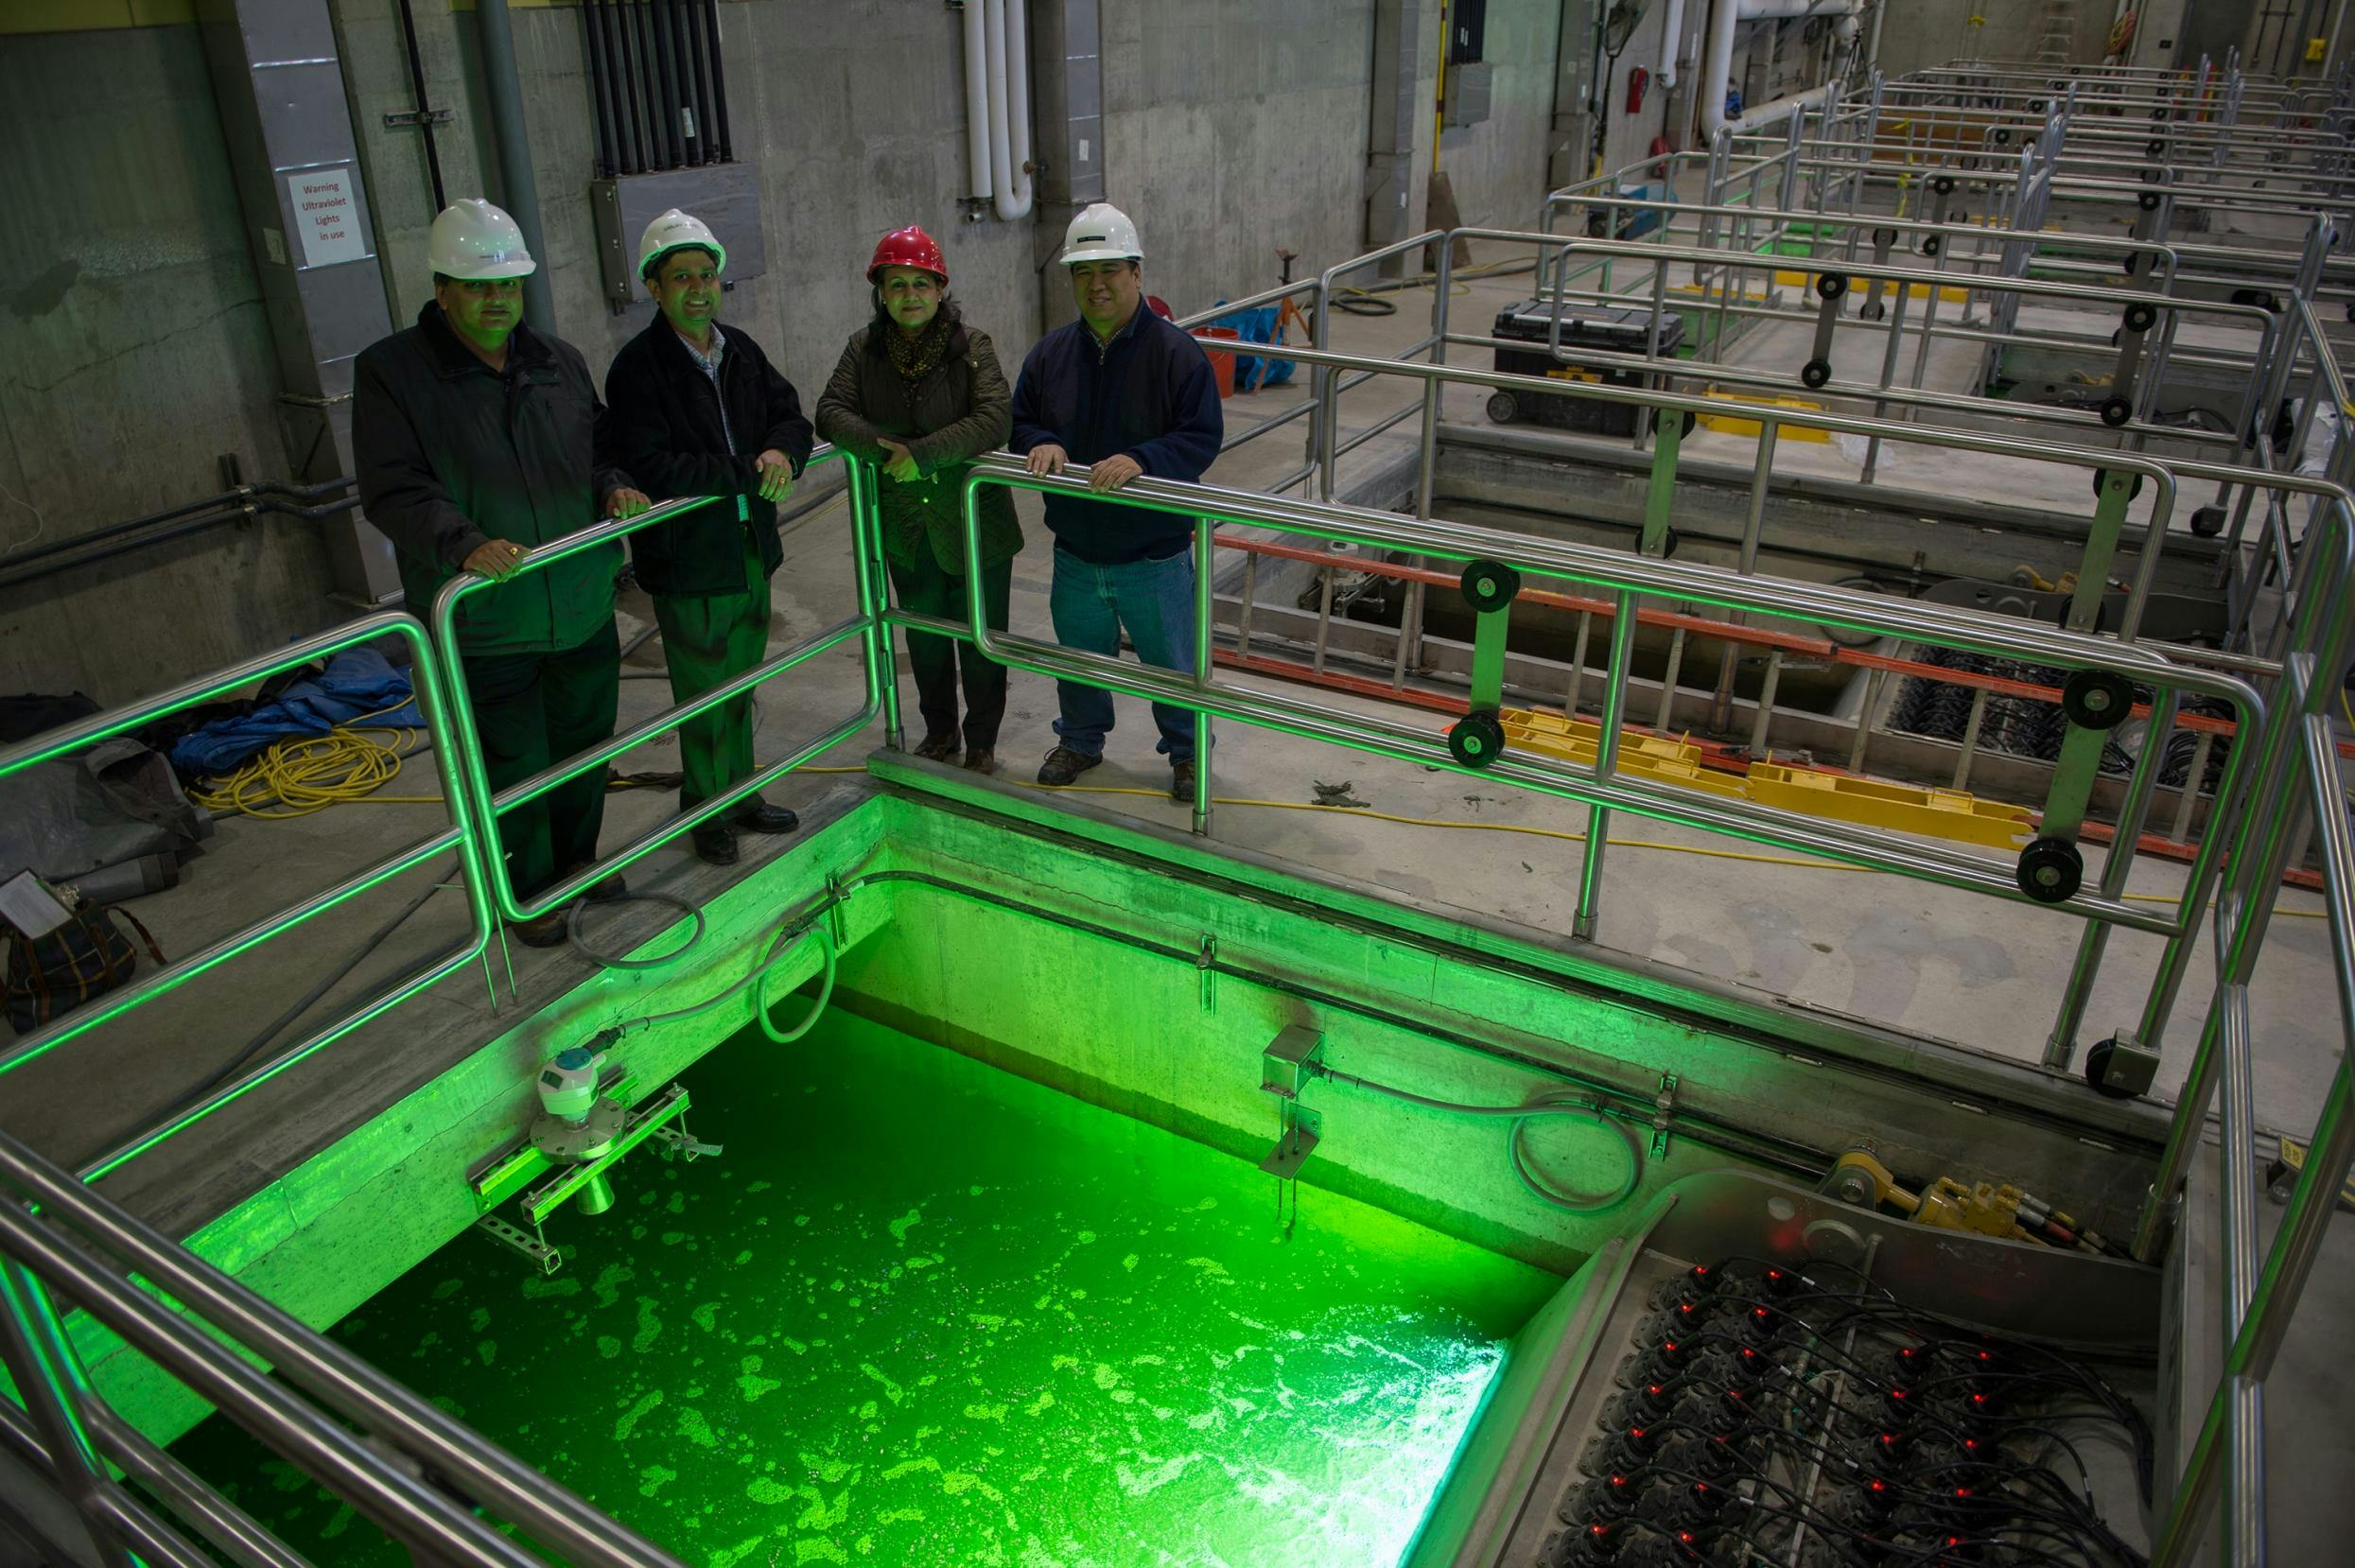
our interceptors before flowing to WRPs where we clean the water and recover resources using a combination of physical, biological, and sometimes chemical, treatment processes.
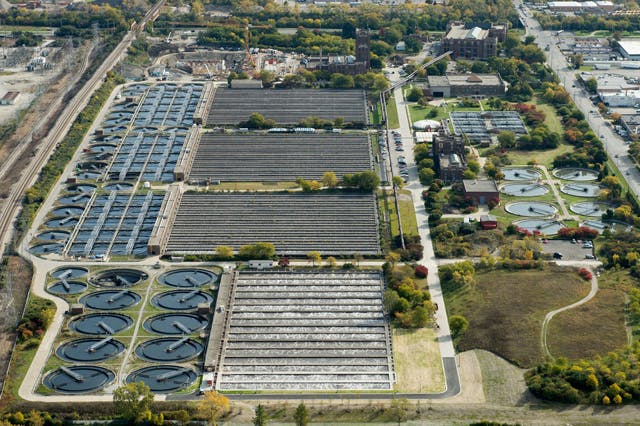
The MWRD provides this service for over 5 million people. Nearly 450 billion gallons of wastewater is treated by our seven facilities every year.
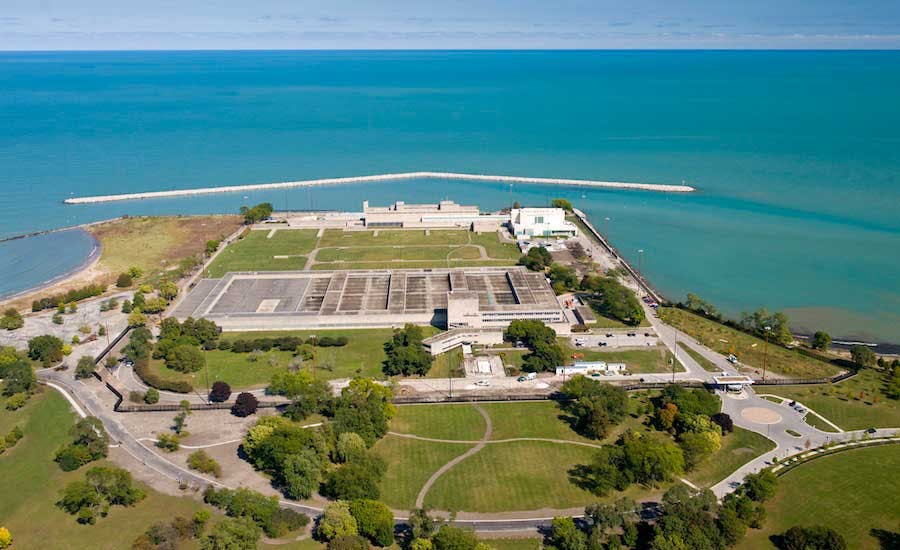
The Terrence J. O’Brien Water Reclamation Plant (WRP) is one of seven wastewater treatment facilities owned and operated by the MWRD. The MWRD is the wastewater treatment and stormwater management agency for the City of Chicago and 125 Cook County communities. We work every day to mitigate flooding and convert wastewater into valuable resources like clean water, phosphorus, biosolids and natural gas.
If you live within our service area, the water that goes down your toilet, sinks and drains eventually comes to us to be cleaned. We treat wastewater from homes and businesses throughout our 883-square-mile service area in addition to stormwater from some communities. All of this wastewater and stormwater flows through local sewers into
our interceptors before flowing to WRPs where we clean the water and recover resources using a combination of physical, biological, and sometimes chemical, treatment processes.
The MWRD provides this service for over 5 million people. Nearly 450 billion gallons of wastewater is treated by our seven facilities every year.