Week 2: The Truth About Drinking Water

Share Week 2: The Truth About Drinking Water on Facebook Share Week 2: The Truth About Drinking Water on Twitter Share Week 2: The Truth About Drinking Water on Linkedin Email Week 2: The Truth About Drinking Water link

Consultation has concluded

Water: A City's Basic Necessity

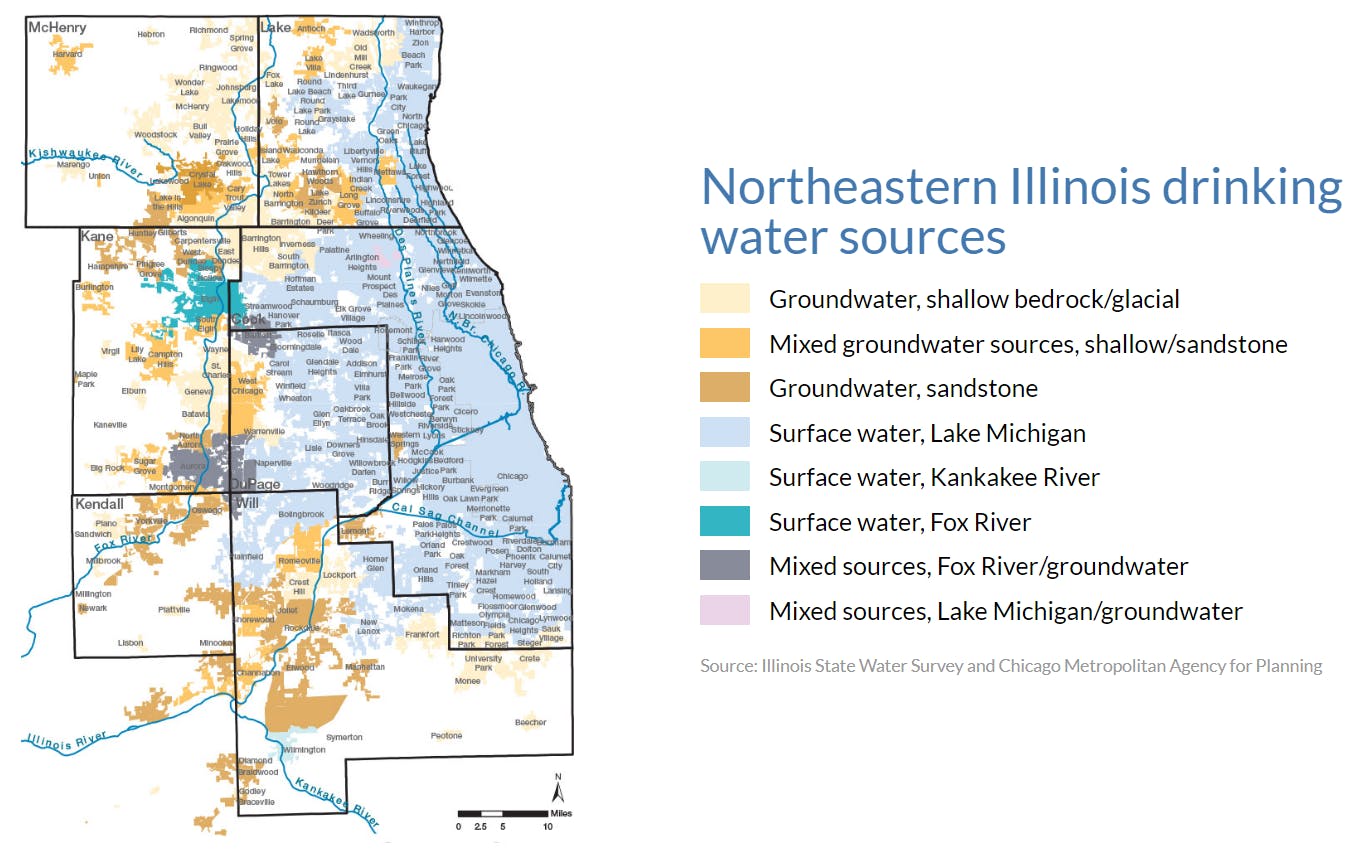
Do you know where we get our drinking water from? This foundational session will introduce you to the water systems in Northeastern Illinois, including sources of drinking water and the infrastructure that carries this water into our homes, schools, and businesses. Learn how local planning decisions influence water quantity, quality, and affordability, as well as how climate change impacts our region's future drinking water supply. Nora Beck, a senior planner at CMAP, will join this conversation in discussing CMAP's water planning initiatives. By the end of the session, you will have gained a deeper understanding of the current issues surrounding the region's drinking water.

About this Page

This is the landing page for our second week, which is on drinking water. Like last week, feel free to explore the tools below and to the right of this post to gain a better understanding of what you can look forward to in this session.

  • Before Thursday's session, take a look through the Pre-session Content and Activity tabs below to familiarize yourself with relevant resources put together by the sessions leaders. These tools will help you form a foundation for the week's session.
  • Let's Talk functions the same as the one found on the FLIP homepage and from urban street festivals last week. The only difference is that discussions are catered toward drinking water. Share your observations and knowledge on drinking water!
  • Show off your water knowledge in Water Trivia. Answer correctly to get the chance to earn a gift card!
  • Share your favorite picture of a beach, lake, pond, river - or any other body of water - in the Photo Board.
  • Session documents can be found to the right. There, you will find relevant resources to help you start building a foundation of what you can expect for this week. Take a look through them before the session on Thursday.
  • You can find out more about your session leaders under Meet the Team.

Click here to go back to the FLIP homepage.

Water affordability and Equity

Water affordability is a growing concern facing all municipalities in our region. To better understand and explore the extent to which communities are facing challenges to water affordability, Metropolitan Planning Council, Elevate Energy, and Illinois-Indiana Sea Grant developed a dashboard tool that breaks down water affordability statistics by municipalities in metropolitan Chicago. Explore the data on your own and join the live session to share your findings and discuss how to address water equity in a time of rising costs. 

Select the community you live in or a community you are familiar with or are interested in knowing better, and post your responses to the following questions: 

  • What is the average water bill? How does it compare to other essential monthly expenses (i.e. housing and transportation costs)? Hover over the “Essential Monthly Costs” bar 
  • Has the average water bill increased or decreased since 2008? Why might the water bill have gone up or down?        
  • Has the water bill outpaced the growth in income? If so, by how much? 
  • How many hours does a low-income household need to work to pay their water bill? 
CLOSED: This discussion has concluded.

  • Share Dolton, Illinois on Facebook Share Dolton, Illinois on Twitter Share Dolton, Illinois on Linkedin Email Dolton, Illinois link

    Dolton, Illinois

    by ekouassi16, over 3 years ago

    Although I live in New Jersey, I have a friend that is from Dolton so I am aware of the community. Dolton is a predominantly black community, directly south of Chicago's Riverdale. Dolton's population has been decreasing since the 70s due to the massive closing of factories in Chicago. This has spurred a myriad of problems including the significant increase in the water bill for the residents of Dolton. In fact, MPC reports that Dolton's average household income has increased by only 1% since 2008. Compared to the whopping 123% change in the average water bill for the residents. The... Continue reading

  • Share Naperville on Facebook Share Naperville on Twitter Share Naperville on Linkedin Email Naperville link

    Naperville

    by lectrician1, over 3 years ago

    The average water bill is $68. It is very little compared to the average transportation and housing costs. It has increased by 76% since 2008. I think this is because of infrastructure replacement costs. We are already a well-developed city and have got our water from Lake Michigan, but I'm not sure about how up-to-date our system is. The water bill has outpaced the growth in income by 49%. A low-income household needs to work 5.3 hours to pay their water bill.

  • Share River Forest on Facebook Share River Forest on Twitter Share River Forest on Linkedin Email River Forest link

    River Forest

    by GeorgeB, over 3 years ago

    The average water bill is $74. It is very low compared to the transportation and housing costs. Since 2008, the water bill has increased by 108%. I think some of this cost came from increased maintenance on the old pipes, but I have no idea how they can jump 108%. The water bill has greatly outpaced the income growth, with income only increasing by 7% since 2008. A low income household would have to work 6.4 hours to pay the water bill.

  • Share Chicago on Facebook Share Chicago on Twitter Share Chicago on Linkedin Email Chicago link

    Chicago

    by iclifford, almost 4 years ago

    The average water bill is $40 a month, which is less compared to other costs. It has increased by 79% since 2008 and has outmatched the growth of income because income increased by 27% and water increased by 79%. Low-income households need to work 11 hours.

  • Share Chicago on Facebook Share Chicago on Twitter Share Chicago on Linkedin Email Chicago link

    Chicago

    by Rhea Banerjee, almost 4 years ago

    I was interested in looking at Chicago's stats. The average water bill is around $40 per month, which is not as high as the transportation or rent expenses because it's in a city. It has increased by 79% since 2008, probably because the resources from Lake Michigan have been depleted. It has also outpaced the growth of income because income increased by 27% while water increased by 79%. Low-income households need to work 11 hours.

  • Share Barrington on Facebook Share Barrington on Twitter Share Barrington on Linkedin Email Barrington link

    Barrington

    by Cyoo , almost 4 years ago

    The community I picked was Barrington:

    The average cost of a water bill is $65. The average transportation is $1,169 and house is on average $2501.

    The water bill has gone up 28 percent. I think this may have happened because, according to an article in the Chicago Tribune Barrington needed funding to upgrade the sewer systems.
    The water bill has outpaced the growth income. The water bill has outpaced it by 3 percent.

    A low income household would have to work 6 hours a day to pay for the water bill.


  • Share Norridge on Facebook Share Norridge on Twitter Share Norridge on Linkedin Email Norridge link

    Norridge

    by Emily Breen, almost 4 years ago

    The average monthly water bill in Norridge is around $40, which is relatively cheap compared to the housing costs ($1899) and transportation costs ($1060). Since 2008, the water bill in Norridge has increased by 79%, probably due to the increased use of a limited supply of water by a growing population. Meanwhile, the average income in Norridge has only increased by 27%, the growth in the water bill has outpaced the growth in income by 43%. A low-income household would need to work 11 hours to pay their water bill in Norridge.

  • Share Chicago on Facebook Share Chicago on Twitter Share Chicago on Linkedin Email Chicago link

    Chicago

    by cbrasseur, almost 4 years ago

    In Chicago, water bills are typically $40 a month. Compared to other monthly expenses, such as trasnportation and housing, this is cheap because housing and transportation costs hundreds or thousands of dollars monthly. The average water bill has increased about 79% since 2008, likely because of higher water demand and a larger population. The water bill has outpaced the growth in income by 27%. A low-income household has to work around 11 hours to pay their water bill.

  • Share Chicago on Facebook Share Chicago on Twitter Share Chicago on Linkedin Email Chicago link

    Chicago

    by ryleighcarrier, almost 4 years ago

    The average monthly water bill for Chicagoans is roughly 40 dollars per month. When compared to other essential monthly expenses the water bill is not at as high of a price point as transportation and monthly rent expenses. The average water bill has increased by almost 80% since 2008. The reasons for this may be to do inflation, as well as scarcity in local groundwater. In order to supply fresh water to millions of residents, multiple pipelines have been created. The construction of such things has likely added to the large increase in expenses. The water bill has greatly outpaced... Continue reading

  • Share Des Plaines on Facebook Share Des Plaines on Twitter Share Des Plaines on Linkedin Email Des Plaines link

    Des Plaines

    by mpatel6, almost 4 years ago

    The average water bill is around 40 dollars. It's cheap compared to other essential monthly expenses. It has increased since 2008, and this could be due to the city being more developed, which requires more water, which requires people to pay more. It has outpaced the growth in income, by 15%. 5.7 hours a week is the minimum amount needed to pay their water bills.